Server monitoring is very important to know whether the server is working as it should. By monitoring server performance using server monitoring tools, you can service all requests from clients.
Starting from providing resources, storage, and a powerful processor for all needs. Until you know what is happening to the network, automate various network checks.
The server computer is used to monitor your server 24 hours a day for 7 days. The computer serves to ensure that your server is working stably and efficiently. This monitoring service is done online and can be tailored to your needs and budget.
There are many free server monitoring applications that you can use to help monitor server performance. But before that, it helps you read about what monitoring is and what are the problems in monitoring servers.
What is a Monitoring Server?
Server monitoring is an activity of monitoring server system resources such as CPU usage, memory consumption (Memory RAM Consumption), network, disk usage (disk usage), and so on.
Because the performance of your application or website is largely dependent on server performance. Then, a monitoring service is needed that can ensure that your server machine can meet all the needs of the website and manage your applications properly.
Through the monitoring server, you can get data related to your operating system. For example, see how your system works. Another thing that is not less important, you can also monitor the security of your server.
To be able to ensure that a server is working properly, you need to use server monitoring tools. We will discuss what are the best server monitoring tools you can use, after the sections below.
Problems that are often found in Server Monitoring
Managing large numbers of servers with limited resources is the biggest challenge in monitoring server performance. Because different servers usually have different OSes too.
Automatic, it needs special methods for server implementation, management, and monitoring. Therefore, it is important for server monitoring to improve system services.
To be able to improve server services so that the scope is comprehensive and in-depth, you as a developer need to recognize five main problems in monitoring servers:
1. Minimal disk space.
The ever-increasing number of computer applications, files, and ERP used to make disk space needs also continue to increase.
As the volume of data increases, the time needed to respond also increases. It happened because the application in charge of reading and writing data did not work efficiently when disk space was minimal.
2. Excessive CPU usage.
As the brain of a server, the CPU has a certain capacity limit. That means the CPU has limited ability to handle processing requests from any application that requires a source.
Excessive and continuous CPU usage can even knock down the best servers. That usually happens because:
- The application is poorly written and consumes a lot of CPU time.
- Malware that has infected the server.
- “Memory leaks” from programs that fail to delete data that is no longer needed.
- Several major disruptions are caused by inefficient page-swapping.
3. Damage to hard drives.
Network monitoring programs will usually alert the system administrator if a device is potentially damaged. The IT team will then determine what steps should be taken. Whether to use a backup hard drive or replace it.
4. Databases and applications that do not work.
Minimal disk space and excessive CPU usage can make databases and applications unable to work.
5. Unexpected spikes in network traffic.
Schedule backups on the LAN, use of remote backup tools, and virus scanner updates can cause significant spikes in network traffic. Unexpected spikes such as mail server problems, malware outbreaks, or hacking attempts need to be monitored and investigated. If not, the attack can have a wide negative impact on your IT system.
10+ Top Free Server Monitoring Tools
To avoid the five main problems above, you need a reliable server monitoring application. What are some free server monitoring tools that you can use? Here’s the list for you!
1. Ganglia

Ganglia is an open-source monitoring system (BSD License) specifically designed for high-performance computerized systems such as clusters and grids. This tool produces analytical data that is scalable and easily distributed.
This monitoring system utilizes widely used technologies such as XML for data representation, and XDR for data transportation. One goal is to engineer data structures and algorithms to maximize efficiency.
Advantages:
- As a solid monitoring platform, Ganglia supports many operating systems and processors. Large clusters throughout the world use this platform, especially within the university.
2. Nagios Core

Nagios® is an open-source tool that is widely used to monitor server and network performance. Nagios® is also commonly used to monitor systems, applications, services, and various business processes in DevOps ( developers and operations ) projects. Many IT experts consider Nagios to be an easily customizable tool on the most reasonable budget.
Advantages:
- Nagios® will quickly notify their technical staff if there are problems with your system, application, service, server, or network. That way, the repair process can be done immediately. So, this problem has no impact on end-users, customers, and the running of your business.
- Nagios provides tools to monitor applications and application status. Including Windows applications, Linux applications, UNIX applications, and web applications.
3. CollectD

CollectD is a popular open-source monitoring server. This tool collects basic system performance statistics from time to time. CollectD also stores the data it collects in various formats. One of them is the RRD file that Cacti can use to graph data.
This server monitoring tool is commonly used in DevOps projects as an open-source collection agent. CollectD is usually integrated with various graphics tools such as Graphite, Grafana, or Cacti.
Advantages:
- CollectD is written in the C ++ programming language and is available for several operating systems. There are several plug-ins for various systems that allow you to collect data outside important system metrics, such as CPU and memory.
- It has more than 100 plugins from standard cases to highly specialized and sophisticated ones.
This server monitoring tool provides powerful network features and can be developed in various ways.
4. Spiceworks

Spiceworks has several free IT tools in addition to the server monitoring solution that we focus on here. Free monitoring tools Spiceworks can provide insight into many aspects of your infrastructure, such as servers, switches, SNMP devices, and services.
Advantages:
- Setting Dashboard connectivity for Spiceworks is very easy. You can install this monitoring tool on any server, configure the application URL, and then start monitoring.
- Skillful in giving warnings. You will immediately get a warning in the form of an email when your website application cannot be accessed by the user.
- Spiceworks will always provide the latest information and notify you if the network is slow, or the application load is too heavy. Even before crashes and complaints from users.
5. Cacti
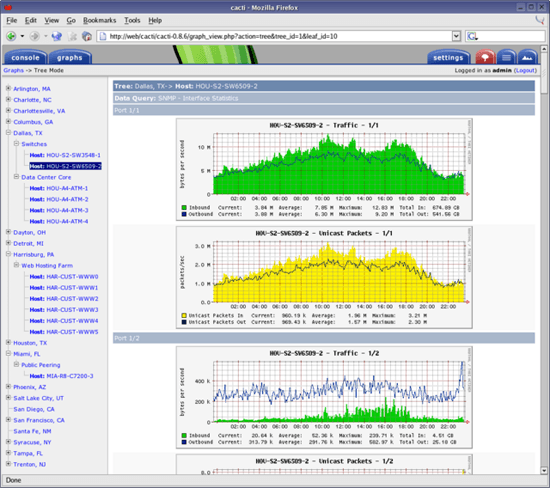
Cacti is a graphical front-end tool for data systems and data collection. Data collection takes place in cron via an external script that feeds the metrics stored in the MySQL® database.
Cacti uses RRDTool, an open-source recording and data system to store the surveyed data so that it can produce all types of graphs for each dataset. You can create all types of graphs that can be displayed and arranged in several different ways.
Advantages:
- Has a developer community that has contributed to plug-ins, scripts, and templates. All of this you can use to monitor almost every type of device.
- Cacti provides modern graphics templating, several data acquisition methods, and out-of-the-box management features.
6. Zabbix
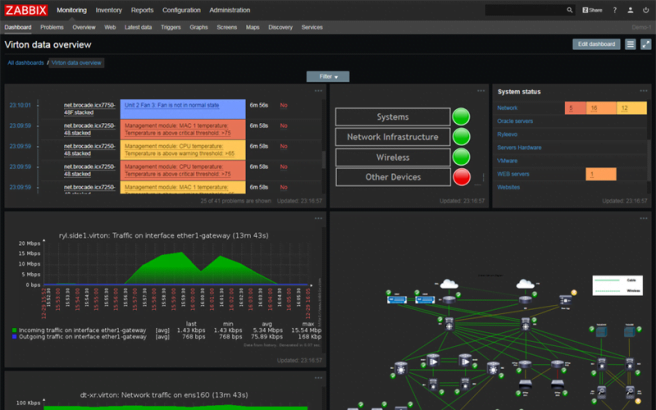
Zabbix is a server monitoring tool for enterprise-class. This tool is written in PHP. This server monitoring tool is equipped with many useful features and has premium support options.
Zabbix allows users to check uptime and response times from services. This tool also responds remotely from SMTP or HTTP. For statistics on on-systems such as CPU, network utilization, and disk space, you can use SNMP.
Advantages:
- Zabbix offers good performance for operating system monitoring and specific application metrics.
- Zabbix can be updated easily. No need to change anything to the database backend.
- Zabbix also offers flexibility in two-way integration with enterprise applications.
7. Icinga

Icinga offers many database connectors for MySQL, Oracle, PostgreSQL, and API REST. By using this new API feature, sysadmin, and users can easily integrate various extensions without modifying the core of Icinga directly.
Advantages:
- Icinga can collect data about host resources (such as CPU load and disk usage) on various types of devices (switches, routers, temperature and humidity sensors, etc.).
- This server monitoring tool has warning options including email, SMS, and user-defined methods that can be written on the Icinga server.
- Icinga uses a modern user interface, and additional database connectors for MySQL, Oracle, PostgreSQL, and REST API. All that allows Icinga to integrate various extensions without complicated changes to the core of Icinga.
8. OpenNMS

OpenNMS is an open-source platform designed to manage tens of thousands of devices from one server. OpenNMS is also tasked with managing multiple devices using a group of servers.
Advantages:
- OpenNMS can monitor various hardware, operating systems (such as Windows, Linux®, Solaris), and virtualization platforms (such as VMware®, Hyper-V®, Citrix XenServer).
9. WhatsUp Gold

WhatsUp Gold includes a powerful REST API that makes it easy to integrate with your own system or scripts. You can also extract the latest status information for use by other systems.
Advantages:
- WhatsUp Gold provides a complete view of the status and performance of applications, and network devices, whether for cloud servers or not.
- This tool has a concise interface and the ability to find, map, and display most of the tools commonly used by small and medium businesses.
10. Monitis
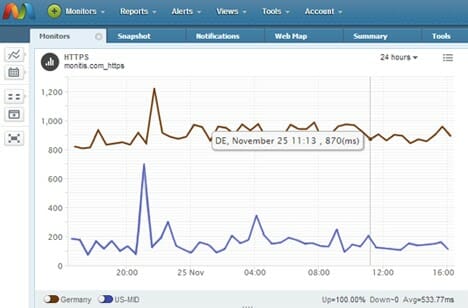
Monitis.Us is a cloud-based server monitoring tool that provides both internal server resources (tracking disk space usage, RAM, CPU, and traffic) and external servers (measuring the active time of the application and end-user experience).
Advantages:
- Monitis.Us can monitor servers from Linux and Windows for free.
- Because it is cloud-based, you can easily install this tool and configure it.
- With Monitis.Us, you can also monitor databases and networks by first creating a special dashboard.
11. Solarwinds Server Health Monitor

This free monitoring tool can track the health, status, and availability of server hardware in minutes. Solarwinds lets you see the status and performance of important server hardware components, such as fan speed, temperature, power supply, CPU, battery, and others.
Advantages:
- With this tool, you can quickly identify server hardware problems that have an impact on server and application performance.
You can also monitor hardware health status and metrics from Dell®, PowerEdge ™, HP®, ProLiant®, IBM® servers, eServer Xseries servers, and VMware ESX / ESXi hypervisor.
Conclusion:
Now you can choose any tool you think is best and suits your needs. I hope you have got a brief idea about the Server Monitoring system. If you have any doubts or queries related to this article you can comment below we will get back to you with the solution.
Mustafa Al Mahmud is the Founder and CEO of Blogger Concept and also a professional Blogger, SEO Professional as well as Entrepreneur. He loves to travel and enjoy his free moment with family members and friends.